Near-Correction to Stock Market Highs: We Still Stink at Investing

The WSJ’s Morgan Housel gets the market-timing award of the season. On September 13th, he wrote “With stocks more than doubling in value over the past five years, now is the time to prepare yourself for the emotional roller coaster that will come during the inevitable correction.” (Emphasis mine.) While an official correction of 10 percent did not materialize, on September 19th, just days after Housel's article was published, the S&P 500 hit an all-time high of 2,019 and then began a 9.8 percent plunge to an intra-day low of 1,820 on October 15th. U.S. stock indexes reclaimed new highs on Friday (see the numbers below), rescuing what was shaping up to be an ugly month. Market action in October was a great lesson in a few tried and true investment mantras, like “stick to your game plan”, “being an investor means signing up for ups and downs from time to time” and “don’t let your emotions take over”.
And about those emotions…they really can mess with your investment returns, because so often, they lead you to buy high and sell low, which can cost the average investor about three percentage points a year in lost return over the long run. The proclivity to trade at exactly the wrong time encouraged Business Insider to add “YOU SUCK” to this chart from Richard Bernstein Advisors: (click on the chart to enlarge):
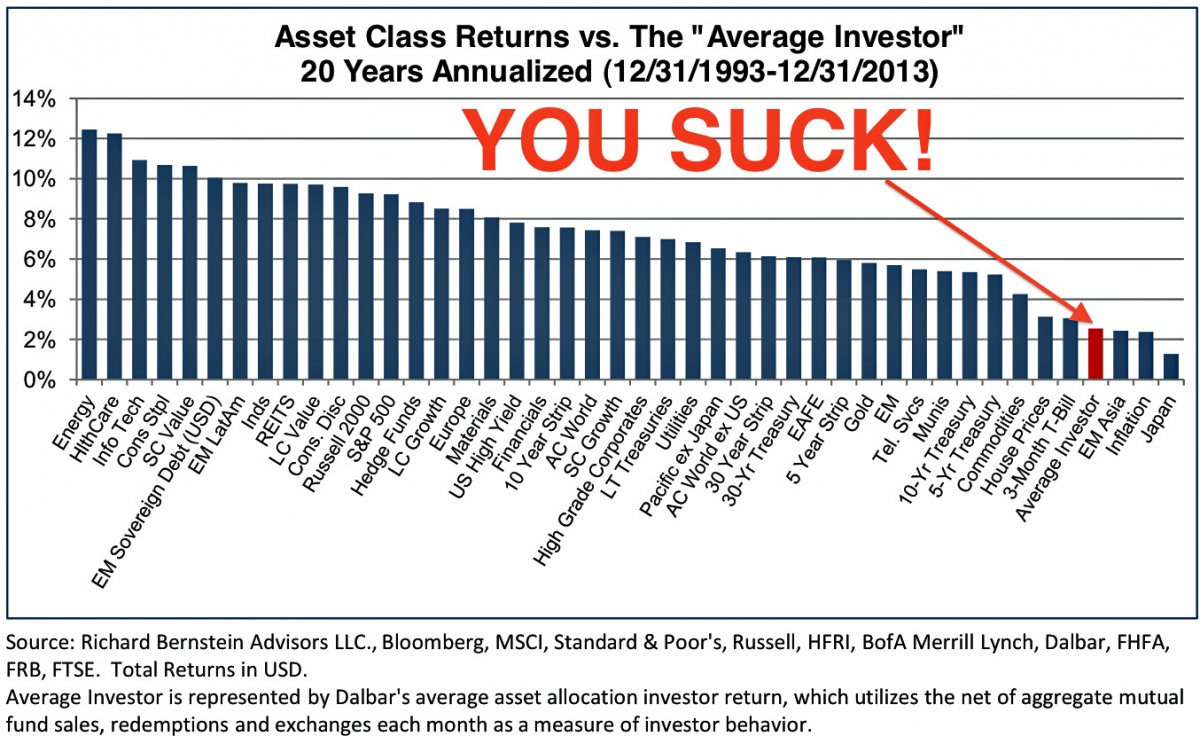
You’ll notice that during this twenty-year period, which includes the dot-com boom and bust, as well as the recent housing and credit boom and bust and the Great Recession, the Average Investor has not done too well. The reason is clear: people jump in and out of markets at the wrong time! The best defense against those emotional decisions is to stick to that diversified portfolio and don’t mess with it when markets move up or down.
Now that we got that out of the way, let’s return to a fundamental question: How is the economy doing? The first reading of third quarter US growth came in at a better than expected 3.5 percent annual pace, boosted by a 7.8 percent surge in exports and a 10 percent jump in federal spending. That’s the good news. The not-so-good news is that consumer spending, which accounts for about two-thirds of the economy, slowed to a 1.8 percent annual pace from 2.5 percent in the second quarter. As we enter the all-important holiday season, economists are eager to see whether consumers become a tad less parsimonious and open those physical and electronic wallets to spend more freely.
One reason consumers may not have been as willing to spend is that wage growth has only increased at about the pace of inflation. There will be more information about that when the October jobs report is released on Friday. Economists predict that employers added 225,000 jobs and the unemployment rate remained at 5.9 percent, the lowest level since July 2008. If the numbers improve dramatically, it could actually have a negative impact on stocks, as investors may surmise that the Federal Reserve might consider raising short-term interest rates sooner than expected…higher interest rates are seen as a headwind for the stock market.
Reports on manufacturing, as well as factory orders and vehicle sales could tell us whether the combination of a global slowdown and a stronger US dollar is starting to negatively impact US exporters. Last year, manufacturers contributed just over $2 trillion to the economy, which represents 12.5 percent of GDP. But economists focus on the sector because for every $1.00 spent in manufacturing, another $1.32 is added to the economy, the highest multiplier effect of any economic sector.
MARKETS: Just in time for the holiday season and for the first time in four years, prices at the pump for regular gas have dropped to under $3/gallon nationally. Consumers are saving about $250 million a day on gasoline compared with early summer, when the national average hit $3.68 a gallon, according to AAA.
- DJIA: 17,390 up 3.5% on week, up 2% on month, up 4.9% YTD (best percentage weekly gain since Jan 2013)
- S&P 500: 2018, up 2.7% on week, up 2.3% on month, up 9.2% YTD (best two-week gain since Dec 2011)
- NASDAQ: 4630, up 3.3% on week, up 3% on month, up 10.9% YTD (highest level since Mar 2000)
- Russell 2000: 1173, up 4.9% on week, up 6.5% on month, up 0.8% YTD
- 10-Year Treasury yield: 2.34% (from 2.27% a week ago)
- December Crude Oil: $80.54, down 0.6% on the week, down 12% on month (down 25% from June highs)
- December Gold: $1171.60, down 4.9% on the week, down 3.3% on month, down 2.6% YTD (lowest level since Jul 2010)
- AAA Nat'l average price for gallon of regular Gas: $2.99 (from $3.30 a year ago, down 33 cents in October, lowest level since Dec 2010)
THE WEEK AHEAD:
Mon 11/3:
Automobile Sales
9:45 PMI Manufacturing
10:00 ISM Manufacturing
10:00 Construction Spending
Tues 11/4:
8:30 International Trade
10:00 Factory Orders
Weds 11/5:
CBS, NewsCorp, Whole Foods
8:15 ADP Private Payroll Report
10:00 ISM Non-Manufacturing
Thurs 11/6:
AOL, Walt Disney, Zynga
8:30 Weekly Jobless Claims
8:30 Productivity
Fri 11/7
8:30 October Jobs
3:00 Consumer Credit